April 15, 1999
I. Purpose
of the Report on Cost Containment
II. 1993 - 1997 Direct Premiums Written and
Loss Ratios by State
III. Analysis of the Marketplace
Availability
Herfindahl/Hirschman Index (HHI) and Market
Shares by Line
Market Shares of Residual Market Mechanisms
Participation in Alternative Risk
Transfer Mechanisms
Profitability
Property-Liability Industry Profitability
Compared to Noninsurance
Insurance Industry to Noninsurance Industries - - - - - - -
Illinois-Specific Underwriting Results
Compared to Countrywide
Illinois Private Passenger Auto
and Homeowners Underwriting and Profitability Results Compared to Countrywide
Reliability
Profitability
Financial Solvency Regulation
IV. Cost Containment Issues
V. Conclusion and Recommendation
Bibliography
Appendix B: Combined liabilities, surplus, and other funds for all Illinois-licensed insurers
Appendix C: Combined underwriting and investment exhibit for all Illinois-licensed insurers
Appendix D: Combined cash flow for all Illinois-licensed insurers
Appendix E: Combined exhibit of premiums and losses in the State of Illinois for all Illinois-licensed insurers
Appendix F: Combined insurance expense exhibit - Part 3 - for all Illinois-licensed insurers
I. PURPOSE OF THE REPORT ON COST CONTAINMENT
The Illinois Insurance Cost Containment Act (Article XLII, 215 ILCS 5/1202-d) was enacted in 1986 in response to the public's concern about the availability and affordability of commercial liability insurance. That crisis was short-lived, and the market has since been stable, even softening for the past decade.
The Act requires the Director of Insurance to submit an annual report to the General Assembly by April 15th containing his analysis of the Illinois insurance market and his recommendation of the most appropriate and comprehensive cost containment system for the state.
II. DIRECT PREMIUMS WRITTEN AND LOSS RATIOS BY STATE
Figure 1 shows the distribution of 1997 aggregate Direct Premiums Written (DPW) and loss ratios for the top 20 states that reported data to A.M. Best.
Figure 1
State Distribution and Loss Experience (2406 Companies)
(1993 - 1997)
(in bil $) ------------------% of Total DPW----------------- ------------------Direct Pure Loss Ratio (%)-----------------
Rank |
State |
1997 DPW |
1997 |
1996 |
1995 |
1994 |
1993 |
1997 |
1996 |
1995 |
1994 |
1993 |
5 Yr. Avg. | |
1 |
CA |
34,119 |
11.8 |
11.7 |
11.6 |
12.4 |
13.0 |
56.6 |
58.5 |
66.4 |
89.4 |
66.8 |
67.4 | |
2 |
NY |
21,495 |
7.5 |
7.6 |
7.7 |
7.8 |
7.7 |
61.2 |
66.6 |
61.6 |
68.5 |
71.8 |
65.8 | |
3 |
TX |
19,616 |
6.8 |
6.8 |
6.7 |
6.7 |
6.6 |
56.9 |
66.5 |
76.1 |
65.9 |
71.1 |
67.1 | |
4 |
FL |
17,859 |
6.2 |
6.0 |
5.7 |
5.4 |
5.2 |
53.9 |
58.9 |
69.7 |
59.3 |
74.0 |
62.5 | |
5 |
IL |
13,237 |
4.6 |
4.6 |
4.6 |
4.6 |
4.5 |
58.3 |
67.4 |
64.6 |
65.6 |
69.6 |
64.9 | |
6 |
PA |
12,490 |
4.3 |
4.5 |
4.6 |
4.7 |
4.9 |
65.7 |
71.7 |
66.3 |
77.6 |
71.5 |
70.5 | |
7 |
NJ |
11,463 |
4.0 |
4.0 |
4.1 |
4.0 |
4.1 |
65.5 |
68.7 |
69.4 |
74.6 |
72.6 |
70.0 | |
8 |
OH |
10,374 |
3.6 |
3.5 |
3.4 |
3.3 |
3.4 |
67.3 |
70.0 |
66.2 |
66.5 |
62.2 |
66.6 | |
9 |
MI |
10,009 |
3.5 |
3.5 |
3.6 |
3.7 |
3.6 |
65.5 |
65.8 |
63.3 |
68.4 |
57.9 |
64.3 | |
10 |
GA |
7,462 |
2.6 |
2.6 |
2.5 |
2.4 |
2.4 |
57.9 |
60.8 |
73.3 |
63.0 |
70.0 |
64.7 | |
11 |
MA |
7,176 |
2.5 |
2.6 |
2.8 |
2.9 |
3.0 |
55.4 |
60.5 |
52.4 |
56.7 |
52.7 |
55.5 | |
12 |
NC |
6,825 |
2.4 |
2.3 |
2.2 |
2.1 |
2.1 |
60.8 |
95.1 |
61.0 |
62.7 |
65.1 |
69.2 | |
13 |
IN |
6,105 |
2.1 |
2.1 |
2.2 |
2.2 |
2.2 |
67.0 |
73.9 |
66.2 |
67.9 |
62.8 |
67.6 | |
14 |
VA |
5,831 |
2.0 |
2.0 |
2.0 |
2.0 |
2.0 |
57.9 |
66.1 |
59.9 |
61.8 |
61.3 |
61.4 | |
15 |
MO |
5,275 |
1.8 |
1.9 |
1.9 |
1.9 |
1.9 |
57.3 |
60.8 |
64.8 |
63.5 |
70.4 |
63.2 | |
16 |
MN |
5,266 |
1.8 |
1.8 |
1.8 |
1.8 |
1.8 |
65.7 |
61.0 |
57.6 |
64.2 |
66.2 |
62.9 | |
17 |
WI |
5,163 |
1.8 |
1.8 |
1.8 |
1.8 |
1.9 |
57.7 |
58.6 |
59.4 |
61.3 |
58.5 |
59.1 | |
18 |
WA |
5,120 |
1.7 |
1.7 |
1.7 |
1.7 |
1.8 |
69.4 |
69.9 |
60.7 |
59.4 |
61.9 |
64.4 | |
19 |
TN |
5,014 |
1.7 |
1.7 |
1.7 |
1.7 |
1.6 |
61.3 |
61.9 |
65.2 |
62.9 |
58.5 |
62.0 | |
20 |
MD |
4,992 |
1.7 |
1.7 |
1.7 |
1.7 |
1.7 |
57.0 |
64.4 |
61.0 |
63.5 |
59.6 |
61.1 | |
All Other |
73,324 |
25.4 |
25.6 |
25.8 |
25.2 |
24.9 |
59.8 |
65.2 |
63.7 |
60.8 |
63.4 |
62.5 | ||
ALL |
288,215 |
100 |
100 |
100 |
100 |
100 |
60.0 |
65.3 |
65.1 |
67.6 |
66.1 |
64.7 |
Source: Best's Aggregates & Averages - Property-Casualty, 1998 Edition
Figure 1 shows that Illinois:
The chart also indicates that Illinois' loss ratio was relatively consistent from 1993 through 1996, decreasing to 58.3 in 1997. The four states ranked above Illinois in DPW had less consistent loss ratios over the five-year period.
III. ANALYSIS OF THE MARKETPLACE
From both a consumer's and a regulator's standpoint, insurance regulation should serve three functions: ensuring that coverage is available, ensuring that coverage is offered at a reasonable price, and ensuring that coverage is available from reliable insurers.
The Cost Containment Act requires the Department to analyze the marketplace each year to ensure that these functions are being met, and recommend changes that may be needed to correct market problems.
The Department measures the overall competition of the Illinois marketplace by looking at three elements: availability, profitability, and reliability.
The Department measures availability in three ways:
Herfindahl/Hirschmann Index (HHI) and Market Shares by Line
The Department uses the HHI to measure market concentration for specific lines of business. The HHI is the sum of the squares of each company's market share. The Department of Justice uses the HHI to determine the appropriateness of a merger or acquisition. The Index measures the degree of competitiveness (or lack of competitiveness) in any given market. Generally, an HHI level of 1800 or above indicates that a market is becoming too concentrated or may be exhibiting traits of anti- competitive behavior.
Homeowners HHI
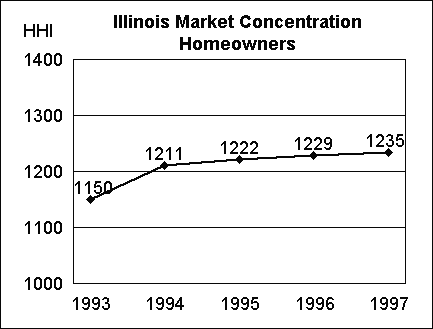
Figure 2 shows the HHI for Illinois homeowners insurance from 1993 - 1997.
During 1997, the top ten writers accounted for 72% of all homeowners direct premiums written in Illinois. Although the trend over the five-year period is upward, the HHI is far from the 1800 threshold. There are some pockets in Illinois where two companies (State Farm and Allstate) dominate the homeowners insurance marketplace. Although many other companies have been vying for larger market shares in those areas, it has been difficult to achieve. The Department has no reason to believe that the large market shares are the result of anti-competitive behaviors. However, the Director will continue to monitor the marketplace to ensure that competition remains a reality for Illinois homeowners. The entry of banks and electronic commerce activities may be the catalysts companies need to increase their market shares in these areas.
Figure 2

The top ten Illinois homeowners writers and their market shares for 1997 are:
State Farm Fire and Casualty |
30.2% |
Allstate Insurance Company |
13.7% |
Country Mutual Insurance Company |
6.4% |
Illinois Farmers Insurance Company |
5.8% |
American Family Mutual Insurance Company |
4.7% |
Economy Preferred Insurance Company |
3.4% |
State Farm General Insurance Company |
2.8% |
Economy Fire and Casualty Insurance Company |
2.1% |
Safeco Insurance Company of Illinois |
2.0% |
Prudential Property and Casualty Insurance Company |
1.1% |
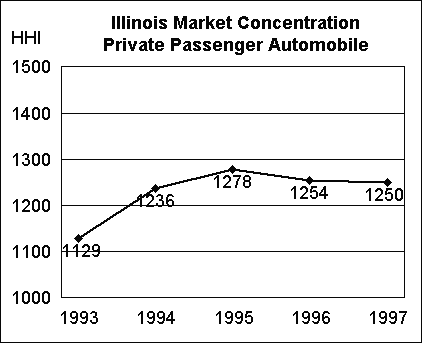
Figure 3 shows the HHI for Illinois private passenger auto insurance from 1993 - 1997.
Again, the HHI is well under the 1800 threshold. During 1997, the top ten writers accounted for 66% of all private passenger auto direct premiums written in Illinois.
Figure 3
The top ten Illinois private passenger auto writers and their market shares for 1997 are:
State Farm Mutual Auto Insurance Co. |
31.6% |
Allstate Insurance Co. |
11.1% |
Country Mutual Insurance Co. |
6.5% |
Illinois Farmers Insurance Co. |
4.9% |
American Family Mutual Insurance Co. |
3.9% |
Economy Preferred Insurance Co. |
1.9% |
Economy Fire and Casualty Co. |
1.6% |
American Ambassador Casualty Co. |
1.5% |
State Farm Fire and Casualty Co. |
1.3% |
Valor Insurance Co. |
1.3% |
Commercial Automobile Liability HHI
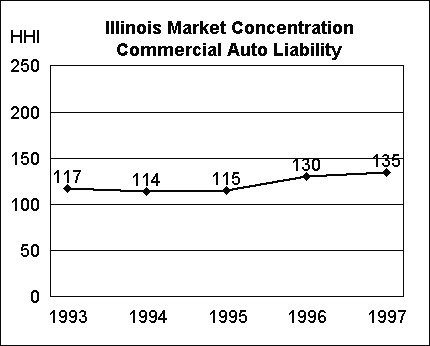
Figure 4 shows the HHI for Illinois commercial automobile liability from 1993 - 1997.
The low HHI shows that this line of Illinois business is highly competitive. During 1997, the top ten writers accounted for only 28% of all commercial automobile liability direct premiums written in Illinois.
Figure 4
The top ten Illinois commercial auto liability writers and their market shares
for 1997 are:
American Country Insurance Co. |
5.4% |
State Farm Mutual Auto Insurance Co. |
3.4% |
Great West Casualty Co. |
3.3% |
Transportation Insurance Co. |
2.8% |
Continental Casualty Co. |
2.6% |
Travelers Indemnity Co. of Illinois |
2.5% |
Liberty Mutual Fire Insurance Co. |
2.1% |
Cincinnati Insurance Co. |
1.9% |
Pekin Insurance Co. |
1.8% |
Northland Insurance Co. |
1.8% |
Medical Malpractice HHI
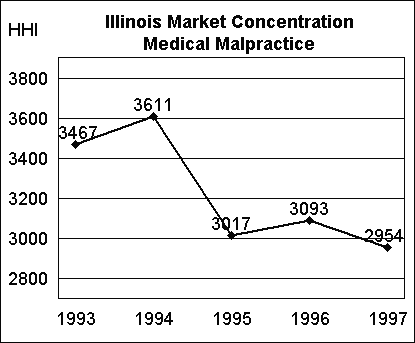
Figure 5 shows the HHI for Illinois medical malpractice coverage from 1993 - 1997.
It is obvious that the HHI is very high, meaning the market is very concentrated. The top ten writers accounted for 80 percent of the written premium in this line. Although 76 insurers wrote medical malpractice coverage in Illinois in 1997, the Illinois State Medical Interinsurance Exchange wrote approximately 50% of all the business. If Illinois were alone in this scenario, the Department would be highly concerned. However, it is common in many states for a physician-affiliated exchange to write the majority of the medical malpractice coverage, while licensed insurance companies and surplus lines insurers write the remainder of the business.
Figure 5
The top ten Illinois medical malpractice writers and their market shares for 1997 are:
| Illinois State Medical Interinsurance Exchange | 49.8% |
| American Continental Insurance Co. | 6.5% |
| Health Care Indemnity, Inc. | 4.1% |
| The Doctors Management Co. | 3.8% |
| St. Paul Fire and Marine Insurance Co. | 3.5% |
| Pronational Casualty Co. | 3.4% |
| Continental Casualty Co. | 3.3% |
| Frontier Insurance Co. | 3.0% |
| Illinois National Insurance Co. | 1.5% |
| Chicago Insurance Co. | 1.4% |
Other Liability HHI
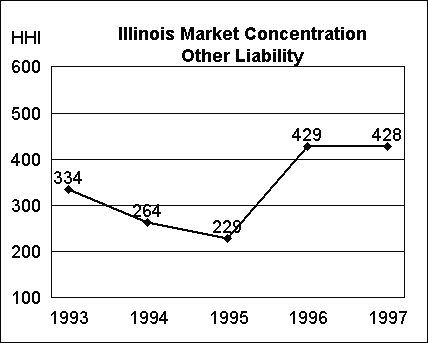
Figure 6 shows the HHI for Illinois other liability insurance from 1993 - 1997. As with other commercial lines, the marketplace for other liability insurance is highly competitive. The top ten writers exhibited a market share of 53 percent.
Figure 6
The other liability line includes such coverages as liability for day-care centers, lawyers liability, liquor liability, liability for parks and playgrounds, and governmental subdivisions. The top ten Illinois other liability writers and their market shares for 1997 are:
| Illinois National Insurance Co. | 19.0% |
| National Union Fire Insurance Co. of Pittsburgh | 10.4% |
| Zurich American Insurance Co. of Illinois | 4.7% |
| Lumbermen's Mutual Casualty Co. | 4.4% |
| Federal Insurance Co. | 3.6% |
| Continental Casualty Co. | 2.9% |
| Underwriters at Lloyds London | 2.6% |
| Attorneys Liability Assurance Society, Inc. RRG | 1.9% |
| Montgomery Ward Insurance Company | 1.6% |
| State Farm Fire and Casualty | 1.6% |
Liquor Liability
There has been a minor shift in the liquor liability market since the merger between CNA (Continental Casualty) and Continental Insurance Company. CNA's market share has decreased considerably, although it is still a major writer. Several other insurers increased their market shares when CNA's written premiums declined. There was speculation that the market would harden after the Illinois legislature increased liability limits. However, prices have not skyrocketed, nor has the market dried up as feared. The fact that only 26 policies were written through the surplus lines market in 1998 shows that the voluntary market is viable. The top ten writers in this market are:
Underwriter's at Lloyds London
Continental Casualty Company
Illinois Casualty Company
Illinois Founders Insurance Company
First Financial Insurance Company
Springfield Fire and Casualty Company
Northland Insurance Company
Truck Insurance Exchange
Transcontinental Insurance Company
West Bend Mutual Insurance Company
Lawyers' Professional Liability
The Illinois lawyers' professional liability insurance market has changed little over the past few years. In 1998, 95 lawyers' professional liability policies were written through the surplus lines market. These 95 policies accounted for $3.1 million of premiums, making the surplus lines market 4th in overall premiums for this coverage. Because lawyers' professional liability is one of the smallest markets in the state, it requires continuous monitoring. The top ten insurers, writing at least $.5 million each, include:
Continental Casualty Company
Underwriters at Lloyd's London
National Union Fire Insurance Company of Pittsburgh
Coregis Insurance Company
National Casualty Company
First Reinsurance Company of Hartford
St. Paul Insurance Company of Illinois
Evanston Insurance Company
American Zurich Insurance Company
American Home Assurance Company
Day-Care Liability
Although 65 admitted insurers reported they write day-care liability in Illinois, the surplus lines market is the leading writer. In 1998, the surplus lines market wrote 497 day-care liability policies, accounting for $694,000 in premiums. The Department will be monitoring this market very closely in 1999. The top five writers in this market include:
Markel Insurance Company
Church Mutual Insurance Company
Non-profits Insurance Association Inter-Insurance Exchange
Carolina Casualty Insurance Company
Monroe Guaranty Insurance Company
Home Day-Care Liability
Thirty-two insurers reported they write home day-care liability in Illinois. The top five writers in this market are:
State Farm Fire and Casualty Company
West Bend Mutual Insurance Company
Allstate Insurance Company
Country Mutual Insurance Company
State Farm General Insurance Company
Market Shares of Residual Market Mechanisms
States establish residual market mechanisms to provide coverage for consumers who are unable to buy coverage in the voluntary market. If a marketplace does not function well, there will be an inordinate number of consumers in residual market programs. This is because insurers will tighten their underwriting standards, charge prices that are higher than what consumers can get in the residual market program, or stop writing business altogether in states where market problems persist.
Illinois residual market mechanisms provide essential insurance coverage for the hard-to-place risk, at rate levels approved by the Department. Illinois has residual market mechanisms for three lines of insurance: property, automobile, and workers compensation.
Property - The Illinois FAIR Plan Association (FAIR Plan)
Fire and homeowners insurance are placed directly through the FAIR Plan. Both dwelling and commercial insurance are available. Insurance companies share in the FAIR Plan's profits or losses in proportion to their voluntary market shares.
Figure 7 shows the FAIR Plan's dwelling and homeowners written premiums as a percent of total Illinois dwelling and homeowners written premiums for 1994 - 1997.
As the chart shows, homeowners insurance is widely available in the voluntary marketplace. A very small percentage of Illinois consumers (ranging from .43 to .45 percent from 1994 - 1997) bought their insurance through the FAIR Plan. In addition, unlike in many other states, Illinois consumers are not at a coverage disadvantage when they buy insurance from the FAIR Plan.
In many states, property residual market programs only offer dwelling fire or basic homeowners policies. That is not true for Illinois. Illinois has one of the most, if not the most, progressive FAIR Plan in the nation. Illinois consumers can buy virtually the same coverages that are available in the voluntary marketplace, including guaranteed replacement cost, sewer back-up, earthquake, and building ordinance and law endorsements. The prices are also very competitive compared to the voluntary market.
Figure 7
Written Premiums for Illinois FAIR Plan
(1994 - 1997)
| Amount of Written Premiums | As % of Total Written Premiums | |
| 1994 | $4,303,000 | 0.43 |
| 1995 | $4,594,000 | 0.43 |
| 1996 | $4,808,000 | 0.45 |
| 1997 | $4,945,000 | 0.43 |
Automobile - The Illinois Automobile Insurance Plan (Auto Plan)
Private passenger auto risks are assigned to companies on a rotational basis in proportion to their voluntary market shares. Assignments stay with the company and are not shared with other writers. Commercial auto risks are placed through servicing companies. Losses are then divided among the voluntary writers of commercial auto insurance in proportion to their shares of the voluntary business.
Figure 8 compares the 1993 - 1997 market shares for the Auto Plan compared to nationwide data. The percent of written car-years is derived by dividing the number of written car-years insured through the residual market by the total number of written car-years. Note that Illinois has had a much smaller percentage of autos in the residual market (.05 - .16%) than the nationwide composite throughout the years.
In addition, the number of insured written car-years in the Illinois Auto Plan has dropped from 10,458 in 1993, to 8,847 in 1994, and to 3,474 in 1997. This downward trend reinforces the fact that auto insurance is widely available in the voluntary market.
Figure 8
Percent of Automobiles in Illinois Assigned Risk Plan and the United States Composite Automobile Residual Market (1993 - 1995)
1993 |
1994 |
1995 | 1996 | 1997 | |
Illinois |
0.16 |
0.13 |
0.09 | 0.06 | 0.05 |
Nationwide |
4.07 |
4.03 |
3.60 | 3.01 | 3.16 |
Workers Compensation - The Illinois Workers Compensation Assigned Risk Pool
Several insurers act as servicing carriers for the Illinois Workers Compensation Assigned Risk Pool. Losses are divided among the voluntary writers of workers compensation in proportion to their shares of the voluntary business.
Figure 9 shows the percent of Illinois work comp premiums written through the Work Comp Pool from 1993 - 1997. The chart shows a clear downward trend in the amount of business being written in the residual market. In 1997, only 4.3% of the $1,498,586,394 of Illinois direct premiums written for work comp was written through the Work Comp Pool.
Figure 9
Percent of Workers Compensation Written Through Pool (1993 - 1997)
1993 |
1994 |
1995 |
1996 |
1997 | |
Percent of Total |
12.6 |
10.8 |
7.8 |
5.2 |
4.3 |
Participation in Alternative Risk Transfer Mechanisms
Traditionally, the level of participation in alternative markets is an indicator of how well the admitted market is doing at providing coverage at prices consumers perceive to be reasonable. Therefore, if we are to assess the insurance marketplace in terms of availability, we must look at the level of activity in these alternative markets.
One problem with the non-admitted market is that there are few means by which it can be monitored. How many risks are being placed there? How much premium is being written? Because of the Department's limited authority over many of the alternative mechanisms, these and many other questions simply cannot be answered and a complete picture of this aspect of the insurance marketplace is unattainable. This problem has become more prevalent as the number of alternative risk-transfer mechanisms continues to grow.
Surplus lines refers to insurance written by a non-admitted (unlicensed) insurer through a licensed surplus lines producer. The licensed producer must exercise due diligence in protecting the insured since the Department has no jurisdiction over unlicensed companies and the Illinois Insurance Guaranty Fund provides no protection for the consumer. Thus, it is the producer and not the Department who must determine the company's financial stability and standards of management prior to submitting the risk.
Figure 10 shows the number of surplus lines policies written in Illinois for 1995 - 1997. Note that the other liability line exhibits a consistent policy count for the three years. Policy counts for homeowners, commercial auto liability, and medical malpractice have declined while the counts for the two private passenger auto lines have increased.
Figure 10
Change in Surplus Lines Written Premium
(1995 - 1997)
| Line of Business | 1995 Illinois Policy Count | 1996 Illinois Policy Count | 1997 Illinois Policy Count |
| Homeowners | 2079 | 1377 | 626 |
| PPA Auto Liability | 822 | 908 | 1016 |
| PPA Auto Physical Damage | 6742 | 8769 | 9590 |
| Commercial Auto Liability | 96 | 51 | 47 |
| Medical Malpractice | 834 | 776 | 703 |
| Other Liability | 13188 | 12769 | 13223 |
Source: Surplus Line Association
INEX (previously the Illinois Insurance Exchange) provides a market for direct insurance and reinsurance. It is comprised of syndicates which underwrite and insure risks, and brokers who are authorized to place business with those syndicates. Fashioned after Lloyd's of London, INEX serves as a facility, recordkeeper and regulator for the operations of its members. INEX submits an annual financial statement to the Department reflecting both its combined financial position and the financial position of each individual syndicate.
Insurance Pools are groups that join for the purpose of sharing certain risks on an agreed-upon basis. Participants may consolidate their risk exposures without being subject to the same regulatory requirements as admitted insurers. Pools organized under the following Acts are allowed in Illinois:
Captive Insurance Companies may be formed by a company to insure its own risks and exposures, by an association to insure its member organizations, or by industrial insured groups. Illinois captives are regulated by the Department, are required to file certain financial information with the Department, and are subject to examination by the Director.
Self-insurance occurs when individuals or businesses retain their own risks. Entities that self-insure are under no obligation to report premiums, losses, or expenses to any statistical or regulatory body.
To determine if Illinois insurance consumers are paying reasonable prices for their insurance coverage, the Department examines the overall profitability of the marketplace. In monitoring competition in general, and price performance in particular, the Department does not examine individual insurer prices for appropriateness. To do so is virtually impossible. Instead, we monitor the effectiveness of competition, examining the pattern of profits throughout the market.
In examining profitability, the Director must balance the seemingly divergent concerns of consumers and insurers. To protect consumers, rates must not be excessive. There is a fine line between rates that are excessive and rates that are inadequate, especially since insurance policies must be priced long before the results of the pricing decisions are known.
The Department must also be concerned about the long-term viability of our insurance marketplace, including the financial viability of the companies that insure our consumers.
This section includes three discussions about profitability:
1. Property-liability insurance industry compared to noninsurance industries
2. Illinois-specific underwriting results compared to countrywide results
3. Comparison of Illinois and Countrywide underwriting and profitability results for private passenger auto and homeowners insurance
Property-Liability Industry Profitibality Compared to Noninsurance Industries
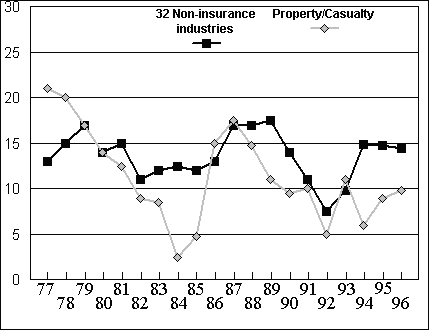
In past Cost Containment reports, the Department used Forbes Magazine's "Annual Report on American Industry" to compare the return on equity (ROE) of the insurance industry to other American industries. Unfortunately, Forbes stopped printing the report in 1999. To present a similar comparison in this and future reports, we will use Standard & Poor's Compustat data taken from an Insurance Services Office (ISO) report, "Insurer Financial Results."
The ISO report compares the Generally Accepted Accounting Principles (GAAP) rates of return on average net worth (RONW) for the property-liability industry with the GAAP RONW of Compustat's composite of 32 noninsurance industries.
Insurance profits tend to be cyclical in nature, showing peaks and troughs over a period of time. Therefore, it is important to compare profitability over a time span that covers at least one complete insurance cycle, generally a period of eight to ten years.
According to the ISO report:
Figure 11
Comparison of Property/Casualty Industry With 32
Other Industries (1977 - 1996)
Illinois-Specific Underwriting Results Compared to Countrywide Results
For each of the coverages listed below, this section contains:
Homeowners
Figure 12 compares the 1997 combined underwriting results for:
Figure 12
Homeowner's Underwriting Results (1997)
Homeowners ($ mil) 1997 |
Illinois* | Countrywide** |
| Direct written premiums | $1,160 | $29,126 |
Direct earned premiums |
$1,121 | $28,123 |
Expenses (% earned premium) |
||
Losses incurred |
66.9% | 55.1% |
Alloc. loss adj. expenses |
3.1% | 3.3% |
Comm./brokerage |
14.8% | 14.6% |
Taxes, licenses & fees |
1.6% | 2.5% |
**Source: Best's Aggregates & Averages 1998, Insurance Expense Exhibit Part III, Aggregate Totals of 2354 Property-Casualty Companies
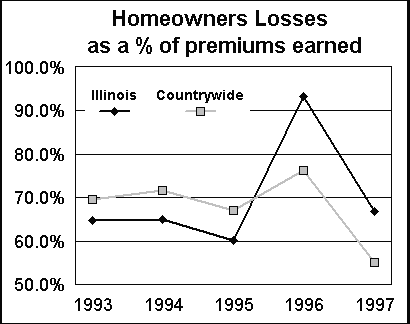
Figure 13 shows the five-year trend for Illinois homeowners losses
and countrywide homeowners losses.
Figure 13
Private Passenger Automobile
Figure 14 shows the 1997 combined underwriting results for:
Private Passenger Auto ($ mil) 1997 |
Illinois* | Countrywide** |
Direct written premiums |
$4,489 |
$115,881 |
Direct earned premiums |
$4,435 |
$113,851 |
Expenses (% earned premium) premium) |
||
Losses incurred |
60.1% |
62.7% |
Alloc. loss adj. expenses |
2.9% |
2.8% |
Comm./brokerage |
10.7% |
9.5% |
Taxes, licenses & fees |
1.1% |
2.4% |
**Source: Best's Aggregates & Averages 1998, Insurance Expense Exhibit Part III, Aggregate
Totals of 2354 Property-Casualty Companies.
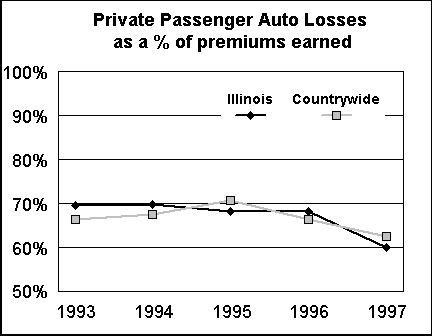
Figure 15 shows the five-year trend for Illinois private passenger auto losses and countrywide private passenger auto losses. As the chart shows, Illinois private passenger automobile losses have been comparable to countrywide losses over the past five years.
Figure 15
Commercial Automobile Liability
Figure 16 shows the combined underwriting results for:
Commercial Auto Liability ($ mil) 1997 |
Illinois* |
Countrywide** |
Direct written premiums |
$549 |
$13,718 |
Direct earned premiums |
$540 |
$13,589 |
Expenses (% earned premiums) premiums premiums) |
||
| Direct earned premiums | $524 | $506 |
| Losses incurred | 73.0% | 68.8% |
| Alloc. loss adj. expenses | 8.2% | 7.6% |
| Comm./brokerage | 12.9% | 14.4% |
| Taxes, licenses & fees | 1.8% | 2.6% |
**Source: Best's Aggregates & Averages 1998, Insurance Expense Exhibit Part III, Aggregate Totals of 2354 Property-Casualty Companies.
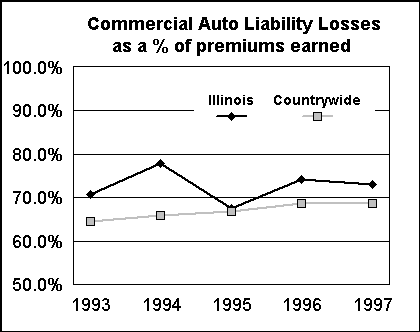
Figure 17 shows the five-year trend for Illinois commercial auto liability losses and countrywide commercial auto liability losses. Illinois losses, as a percent of earned premiums, have been higher than countrywide figures since 1993, with the greatest difference occurring in 1994.
Figure 17
Medical Malpractice
Figure 18 shows the combined underwriting results for:
Medical Malpractice ($ mil) 1997 |
Illinois* |
Countrywide** |
| Direct written premiums | $369 | $5,739 |
| Direct earned premiums | $356 | $5,752 |
| Expenses (% earned premiums) | ||
| Losses incurred | 52.6% | 52.7% |
| Alloc. loss adj. expenses | 30.8% | 24.0% |
| Comm./brokerage | 5.1% | 5.7% |
| Taxes, licenses & fees | 1.2% | 2.1% |
**Source: Best's Aggregates & Averages 1998, Insurance Expense Exhibit Part III, Aggregate Totals of 2354 Property-Casualty Companies.
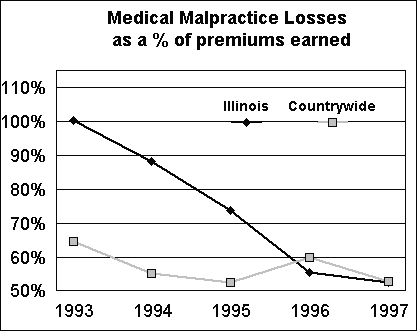
Figure 19 shows the five-year trend for Illinois medical malpractice insurance losses and countrywide medical malpractice insurance losses.
Figure 19
Other Liability
Figure 20 shows the combined underwriting results for:
Other Liability ($ mil) 1997 |
Illinois* |
Countrywide** |
| Direct written premiums | $1,607 | $23,192 |
| Direct earned premiums | $1,430 | $22,253 |
| Expenses (% earned premium) | ||
| Losses incurred | 47.8% | 61.2% |
| Alloc. loss adj. expenses | 11.6% | 16.7% |
| Comm./brokerage | 9.3% | 14.0% |
| Taxes, licenses & fees | 1.8% | 2.1% |
**Source: Best's Aggregates & Averages 1998, Insurance Expense Exhibit Part III, Aggregate Totals of 2354 Property-Casualty Companies.
Figure 21 shows the five-year trend for Illinois other liability insurance losses and countrywide other liability insurance losses. Illinois losses, as a percent of earned premium, were greater than countrywide losses as a whole from 1993 - 1995, while 1996 marked the first time in five years that Illinois' losses were less than the national average for this line. This trend continued in 1997.
Figure 21
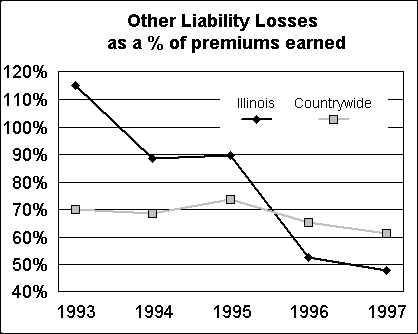
Note: In 1993, Continental Casualty Company, an Illinois-licensed insurer, reported extraordinary losses in Illinois in the other liability line of business which resulted from a settlement of an asbestos-related class action lawsuit by one of the company's policyholders, Fiberboard, Inc.
Back to the top
Illinois Private Passenger Auto and Homeowners Underwriting and Profitability Results Compared to Countrywide
Figures 22 - 27 show, graphically, how the Illinois markets for private passenger auto and homeowners insurance compare to the overall countrywide marketplace (which includes Illinois).
Private passenger auto
Figure 22 shows the historical pattern of Loss Ratios for Illinois and countrywide private passenger auto business. The loss ratio reveals the percent of earned premiums used to pay incurred losses. For example, in 1996, the Illinois private passenger auto loss ratio was 68.5. For every premium dollar earned in Illinois, 68.5 cents was used to pay incurred losses. The loss ratio countrywide was 66.7. For every premium dollar earned countrywide, 66.7 cents was used to pay incurred losses.
Figure 22
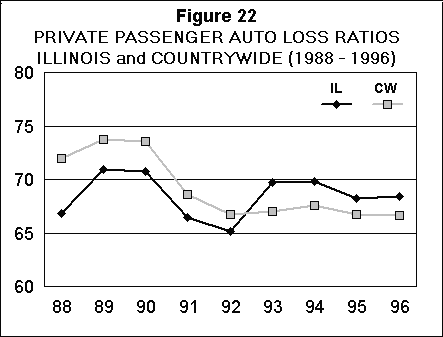
Figure 23 shows the historical pattern of Underwriting Profits for Illinois and countrywide private passenger auto business. Underwriting profit is the amount of profit from insurance transactions - before investment income is added. In 1996, Illinois underwriting profits were -1.4% and countrywide underwriting profits were -1.0%. In other words, the industry made no money from the transaction of private passenger auto insurance business, either in Illinois or countrywide.
Figure 23
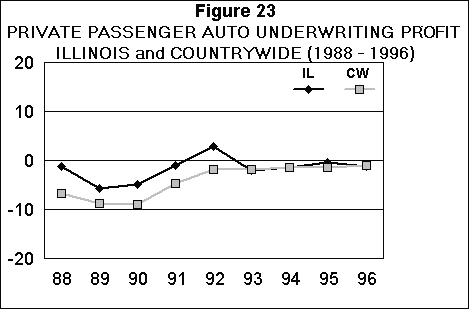
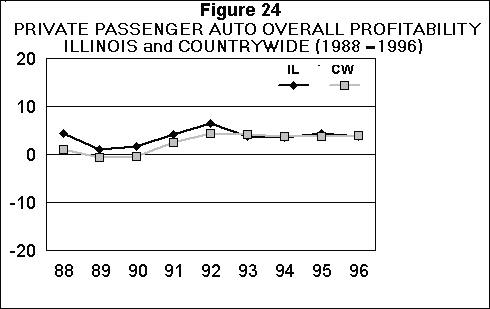
Figure 24 shows the historical pattern of Overall Profitability for Illinois and countrywide private passenger auto business. Overall profitability is the bottom-line profit, which includes profits from investment income. In 1996, overall Illinois profitability for private passenger auto was 3.9% and countrywide was 4.1%.
Figure 24
Homeowners
Figure 25 shows the historical pattern of loss ratios for Illinois and countrywide homeowners business. The loss ratio reveals the percent of earned premiums used to pay incurred losses. For example, in 1996, the Illinois homeowners loss ratio was 93.1. For every premium dollar earned in Illinois, 93.1 cents was used to pay incurred losses. The countrywide loss ratio was 78.6. For every premium dollar earned countrywide, 78.6 cents was used to pay incurred losses.
Figure 25
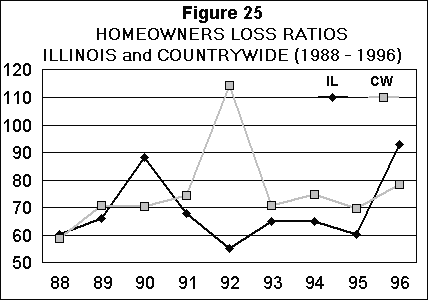
Figure 26 shows the historical pattern of underwriting profits for Illinois and countrywide private passenger auto business. Underwriting profit is the amount of profit from insurance transactions - before investment income is figured in. In 1996, Illinois underwriting profits were -33.3% and countrywide underwriting profits were -21.8%. In other words, industry results from insurance operations alone, in both Illinois and countrywide, were dismal.
Figure 26
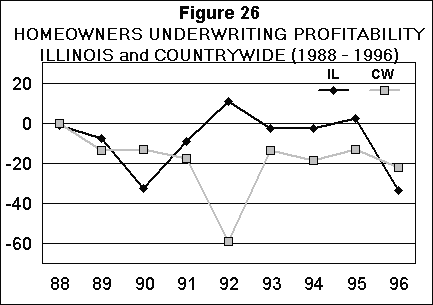
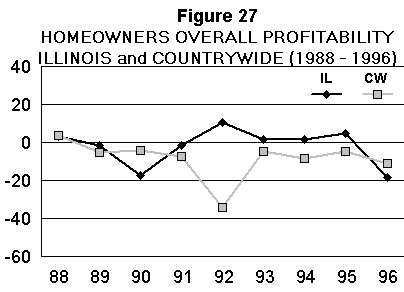
Figure 27 shows the historical pattern of overall profitability for Illinois and countrywide homeowners business. Overall profitability is the bottom-line profit, which includes profits from investment income. In 1996, overall Illinois profitability for homeowners was -17.9% and countrywide was -10.6%. The industry did not make a profit from homeowners insurance in Illinois or overall countrywide, even after investment profits were added.
Figure 27
Summary
We include the following information because it shows that, for private passenger auto and homeowners insurance, Illinois results do not differ significantly from overall countrywide results. There is one exception to this statement: in 1992, countrywide results were adversely affected by Hurricanes Andrew in Florida and Iniki in Hawaii.
Illinois is the only state with a truly open competition regulatory environment -- the marketplace is the principle regulator of rates. Because Illinois results tend to track overall countrywide results, the Department believes that marketplace events, not the type of regulatory environment ultimately drive the results.
The ultimate question the Department must ask is, should we recommend that Illinois continue with its open competition regulatory environment or recommend a different course of action. Historically, other states have argued that regulators should become more involved in setting prices and controlling profits. However, changing to this regulatory philosophy in Illinois would have been costly for both insurers and consumers. It is ironic that in recent years, other states and the NAIC have softened their posture in this regard, especially in commercial lines.
In balancing the needs of consumers and insurers, the Department must ask whether adding more regulation provides benefits that significantly outweigh the costs to insurers, since those costs would eventually be passed on to consumers. In Illinois, we get the same results the rest of the country receives, without interfering in marketplace pricing and spending taxpayer dollars needlessly.
In determining whether our overall marketplace is viable, the Department must consider:
1. Profitability
2. Financial Solvency Regulation
Businesses that provide a financial service must be financially sound. An insurance contract has little value to the insured if there is no guarantee that the insurance company will have the money to pay claims when needed.
As discussed earlier, the Department must balance the seemingly divergent concerns of consumers and insurers. While we must ensure that consumers are able to buy insurance at a reasonable price, we must also ensure the overall viability of the marketplace.
One measure of a company's financial performance is its profitability. Does it generate enough profit to survive? Any business must be profitable to succeed. Over the long run, it must take in more money than it pays out. In a given month or year, its costs may exceed its income, requiring it to pay some of those costs with previously accumulated funds. If the pattern continues, however, the accumulated funds will eventually run out and the business will collapse. Thus an insurance company must manage its income and expenses to assure the profitability on which its survival depends.
A company that can offer insurance coverage at competitive prices and reap adequate profits as an ongoing concern is considered to be financially viable. When the majority of insurers in the market are competitive and profitable, the market is considered to be financially strong.
In the Profitability section of this report, Figures 22 - 27 show that Illinois insurers are not making unreasonable profits. The following discussion on profitability shows that, while Illinois insurers are not making unreasonable profits, they are still profitable, thereby ensuring that our marketplace consists of viable companies.
Profitability
Change in Policyholders' Surplus
One measure of overall profitability is the Change in Policyholders' Surplus from one year to the next. Policyholders' Surplus is made up of: 1) underwriting gains or losses; 2) investment gains or losses; and 3) net contributed capital and other surplus changes.
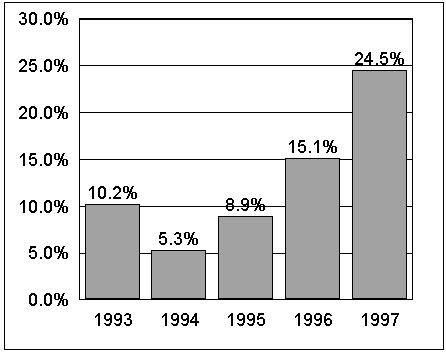
Figure 28 shows the percent change in annual surplus for all Illinois-licensed property-liability insurers for the past five years. As the figure shows, the industry saw rather robust surplus growth in 1997. The small amount of growth in 1994 is attributed to the Northridge, CA earthquake.
Figure 28
Percent Change in Policyholders' Surplus
Source: Best's Aggregates and Averages (1998)
Underwriting Gains/Losses
One factor that contributes to Policyholders' Surplus is Underwriting Gain or Loss. This component is calculated by subtracting Incurred Losses, Underwriting Expenses and Policyholder Dividends from the Revenue from Earned Premiums.
Figure 29 shows the aggregate Underwriting Gain/Loss for Illinois-licensed property-liability insurers for the past five years. As the figure shows, while the Illinois property-liability industry has continually shown a net underwriting loss, such loss has decreased steadily from 1993 - 1997, with a dramatic $9 million change from 1996 to 1997.
Figure 29
Aggregate Net Underwriting Gain/(Loss) (In millions)
| 1997 | 1996 | 1995 | 1994 | 1993 | |
Premiums earned |
$228,209 |
$222,460 |
$214,558 |
$205,997 |
$199,290 |
Losses incurred |
137,686 |
145,286 |
141,864 |
141,425 |
134,157 |
Loss expenses incurred |
28,492 |
28,833 |
28,364 |
26,708 |
25,269 |
Other underwriting exenses incurred |
63,676 |
60,805 |
58,177 |
55,542 |
53,960 |
Dividends to policyholders |
3,443 |
1,947 |
2,499 |
2,217 |
1,884 |
Net underwriting gain/(loss) |
($5,088) |
($14,411) |
($16,346) |
($19,895) |
($15,980) |
Source: Best's Aggregates and Averages (1998)
Net Investment Income Ratio
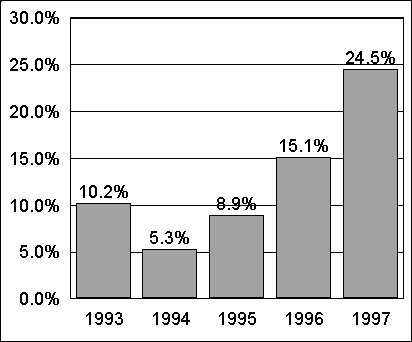
A second item that contributes to Policyholders' Surplus is net income from investments. The Net Investment Income Ratio measures income from invested assets relative to earned premiums. Net Investment Income is calculated by subtracting Investment Expenses and Depreciation on Real Estate from the Investment Income earned during the year. Figure 30 shows the Net Investment Income Ratio for Illinois property-liability insurers for the past five years. As the figure shows, investment income relative to earned premiums has risen steadily since 1994.
Figure 30
Net Investment Income Ratio
Source: Best's Aggregates and Averages (1998)
Return on Policyholders' Surplus
Another way to measure overall profitability is the Return on Policyholders' Surplus. Return on Policyholders' Surplus is calculated by dividing the sum of All Operating Income after Taxes by the Average of Prior and Current Year-End Surplus.
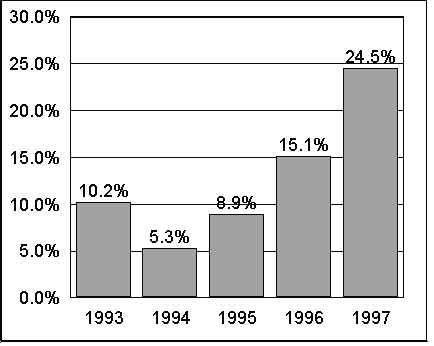
Figure 31 shows the aggregate Return on Policyholders' Surplus for all Illinois-licensed property-liability insurers for 1993 - 1997. As the figure shows, since 1994 (the year of the Northridge, CA earthquake), Return on Policyholders' Surplus has risen steadily. Better underwriting results coupled with a greater return on invested assets since 1994 have helped the industry's surplus dramatically during that five-year period.
Figure 31
Return on Policyholders' Surplus
Source: Best's Aggregates and Averages (1998)
Financial Solvency Regulation
While the Department cannot ensure that Illinois-licensed insurers are profitable, we must ensure that they are financially sound. The Department monitors the financial solvency and strength of Illinois-licensed insurers in several ways:
IV. COST CONTAINMENT ISSUES
The following cost containment issues will require the Department's future attention:
Convergence of the Financial Services Industries
In recent years, there has been much discussion about the convergence of financial services. Banks are beginning to sell insurance and insurance companies such as State Farm and Allstate, are establishing banking entities or applying for thrift charters.
In early 1998, the merger between Citicorp and Travelers became the biggest deal in U.S. corporate history, combining the nation's second-biggest bank with the parent of Salomon Smith Barney and Travelers Insurance.
The Citicorp/Travelers merger and other mega-mergers that have followed, changes the face of financial services for consumers. Certainly the entry of new financial services players will change how Americans buy insurance, particularly in the personal and small-to-medium commercial segments. In these "commodity" class segments, banks will become formidable competitors because of their transaction-based culture, sophisticated customer databases and branch-office networks. A. M. Best estimates that by 2005, three to five percent of all property-liability insurance premiums will be generated through banks.
Many insurers realize they need to reach customers in new ways through multiple distribution channels. Most insurance producers understand the new realities as well.
The changing climate is also forcing regulators of these once autonomous financial services industries, as well as state legislatures and the Congress, to look at regulation and see if changes are needed.
Growth of Electronic Commerce
Similar to the convergence of financial services industries, the Department believes it is important to monitor the growth of electronic commerce. Currently, we are identifying potential issues that will affect not only how the insurance industry interacts with their vendors, their producers and their customers, but also how they interact with the Department, and how the Department interacts with the public. After the Director identifies important issues, we will decide what action, if any, needs to be taken to foster electronic commerce.
Year 2000 (Y2K) Challenges
As in most other industries, preparing computer systems for the Y2K conversion has cost the insurance industry millions of dollars and has slowed or disrupted business plans. The Department is monitoring the Illinois insurance industry to ensure that companies' computer systems are Y2K compliant. Unlike other industries, however, the insurance industry has to concern itself with more than just systems costs.
A. M. Best considers liability associated with the Y2K problem to be the second-most financial risk-rating issue for property-liability insurers, behind only catastrophe risk. Y2K liabilities will saddle a concentrated number of casualty insurers with heavy defense costs, hurting earnings and creating uncertainty for years to come. The Y2K issues involve a host of potential impact coverages including general liability, directors and officers liability, errors and omissions, property, business interruption, workers compensation and securities claims.
The insurance industry is trying to address the Y2K problem in three ways. Some companies are offering Y2K coverage. Other insurers are issuing clarifications to policyholders as to how Y2K is covered under their policies. In other cases, companies are excluding Y2K coverage altogether. In May 1998, the Department issued a company bulletin outlining our position on how companies may add the Y2K exclusion to policies, what activities are considered "inappropriate," and how the Department will deal with companies who are violating the bulletin directives.
No one knows for sure how Y2K will ultimately affect the industry. However, if those who predict Y2K litigation will cost the industry billions of dollars are correct, company profits and consumer insurance costs alike may be significantly affected.
Increasing Lawsuits
America, it seems, is becoming a more litigious society with each passing year, and litigation is affecting insurers' costs in several ways.
First, almost 1/3 of every claim dollar spent on liability claims is spent on lawyers' fees and defense costs. A study by Tillinghast-Towers Perrin concluded that:
Third, in recent years, it appears that class action lawsuits are a growing industry. The Department quite often receives requests for information from attorneys who appear to be looking for class action issues. In fact, many attorneys now use the World Wide Web to look for opportunities for class action suits and to recruit plaintiffs. The claimants' lawyers who have initiated a class action lawsuit against State Farm for their use of non-OEM automobile parts established a web site on the Internet specifically to recruit additional litigants.
From Y2K problems, to drug lawsuits, to mass tort claims for latex sensitivity and tobacco related illness and death, insurers are subjected to a continuing barrage of class actions.
Changing Distribution Channels
Companies who want to remain profitable yet still competitive in today's market will have to find ways to reduce their expenses.
Market overcrowding, soft pricing, reduced business opportunities, technological advances and the convergence of financial services have led many insurers to evaluate their traditional distribution channels and pursue alternative methods to become more efficient and attract new business.
Half of today's top twenty insurers use multiple distribution channels. Companies such as Allstate, Metropolitan, Nationwide, Travelers and Farmers use alternative distribution channels to complement their traditional captive agency force.
Direct response has emerged as a leading alternative channel among personal lines insurers that use traditional agency-based distribution. AIG, Hartford, Nationwide, Travelers and Progressive are examples of companies using some form of direct-response, whether it be through banks, the Internet, direct mail or telemarketing. Affinity group marketing has also grown in popularity. By marketing directly or through third-party administrators, this strategy targets specific groups, businesses and associations.
Catastrophes
The risk of natural events drives the demand for insurance products, while at the same time threatening the industry's financial viability.
According to reports from Munich Reinsurance Company:
Without a doubt, the interest of the worldwide property insurance industry is interdependent with climate, seismic activity and the weather. Human-related factors also contribute to the increased economic and insured losses: prominent growth in population and property values, increased value of personal belongings, increased concentration of people and property in areas at great risk to natural catastrophes (particularly along coastal areas), the questionable management of rivers which allows people to live and work in high-risk areas, drainage of wetlands, logging and farming which have eroded watersheds, and the use of less-resistant building materials and methods.
In 1997, natural catastrophes caused a total of $4.5 billion in insured losses. Things only worsened in 1998. An unusually high number of natural catastrophes worldwide in 1998 led to $15 billion in insured losses -- the fourth highest talley ever, according to a study by Munich Reinsurance Company. This figure was more than triple 1997's total of $4.5 billion.
Windstorms and floods accounted for 90% of the insured catastrophe losses in 1998. Hurricane Georges, the third most expensive hurricane in the U.S. insurance history, caused $3.3 billion in insured losses throughout the Caribbean and Gulf of Mexico region.
Neither insurance regulators nor the industry can prevent natural catastrophes. However, as regulators, we must monitor the financial solvency of our insurers and the effects of large catastrophes on the overall viability of our marketplace.
In an effort to increase capacity for financing catastrophe risks and to spread those risks across broader markets, regulators and insurers are developing methods for securitizing insurance risks, thus creating opportunities for investors in the capital markets to participate in the financing of catastrophe exposures. The Department and the NAIC are developing legislation to allow insurers to offer debt securities directly to the capital markets through protected cell arrangements that allow investors to finance specified insurance risks. Efforts are also underway to enhance capacity through the development of on-shore special purpose reinsurance vehicles and through efforts to pass federal legislation authorizing insurers to fund catastrophe reserves.
V. CONCLUSION AND RECOMMENDATION
The Illinois legislature determines the appropriate insurance regulatory environment for our state and the Department of Insurance works within that environment. The legislature must select an environment that coincides with the economic and social philosophies of its jurisdiction.
Illinois has had an "open competition" regulatory environment for close to thirty years. Under this system, the marketplace is the principal regulator of rates. As long as competition exists, the Department doesn't interfere. Our goal is to ensure a viable insurance market. We want Illinois consumers to receive the best products at the best price, as quickly as possible from solvent, responsible insurers. We want to provide this environment without spending taxpayer dollars needlessly on regulations that don't further this goal, or that aren't cost effective for the benefit provided.
The Department believes that a market driven by competition continues to yield the best results for both the industry and insurance consumers for several reasons.
First, as this report shows, our marketplace is viable. The market is competitive, with a number of companies vying for market share. While competition exists to a lesser degree in some lines (e.g., medical malpractice insurance), Illinois' experience is similar to that of other states for the same lines. Our marketplace is easy to enter and exit. The industry is making reasonable, but not excessive profits.
According to the September 21, 1998, issue of the Auto Insurance Report:
Second, consolidation, technological innovation and greater consumer awareness force businesses to react more quickly to anticipate trends and customer needs. Insurers must be able to be flexible, especially today and in the future when competition will likely take on new forms and put more pressure on the industry. An open competition regulatory environment fosters flexibility.
Third, both insurers and consumers suffer when regulations force insurers to incur costs disproportionate to the benefit provided, as those costs are eventually passed on to consumers. As Figures 22 - 27 show for private passenger auto and homeowners insurance, the Illinois open competition marketplace achieves essentially the same results as the country as a whole, without incurring the costs of additional burdensome and unnecessary regulation. In addition, the money saved by not performing unnecessary regulation allows the Department to concentrate our resources on regulating important consumer issues, such as the delivery and performance of the insurance product itself.
Recently, several states and the NAIC have endorsed the benefits of deregulating commercial lines. After nearly thirty years of achieving favorable results from open competition, in both personal as well as commercial lines, the Illinois Department of Insurance finds it ironic that other states are willing to go only half way. The Illinois Department of Insurance believes that the personal lines consumer should receive the same benefits from deregulation as the commercial insured.
There are cost containment issues that need to be monitored in future years. Underwriting results are not improving to any great degree. Soft pricing persists. Catastrophes continue to take their toll on financial results. The Y2K issue continues to cause concern and uncertainty. The traditional boundaries of insurance and other financial products, as well as geographical boundaries are being eroded.
The insurance environment is changing rapidly and regulators, as well as insurers, are facing more challenges than ever before. Through market conduct reviews, vigilant solvency surveillance, and general marketplace monitoring, the Department has ensured a stable, viable and competitive marketplace that will enable us to respond to these challenges. The current open competition environment works best for both Illinois consumers and insurers. The Department recommends that the legislature continue to support open competition and avoid making changes to the regulatory environment that would have an adverse effect on the marketplace.
1998 Property/Casualty Fact Book.
AIPSO Facts 1998.
A.M. Best Data.
Annual Reports to the Illinois General Assembly on Insurance Cost Containment
(1989 - 1998).
Auto Insurance Report, September, 21, 1998.
Best's Aggregates and Averages, 1993, 1994, 1995, 1996, and 1997,
and 1998.
Best's Review, "Banking on Insurance", Internet Article, 1998.
Best's Review, "Brokering New Approaches", Internet Article, 1998.
Best's Review, "Catastrophes: Insurance Issues", Internet Article, 1998.
Best's Review, "Covering the World With One Umbrella", Internet Article,
1998.
Best's Review, "The Shifting Dynamics of Direct Marketing", Internet
Article, 1998.
Illinois Cost Containment Data.
Illinois Surplus Lines Association Data.
National Association of Insurance Commissioners (State Data Network).
National Council on Compensation Insurance (NCCI) Data.
NAII Greenbook 1998.